Taste research for business teams

Know what your audience loves, and where, before you commit the budget.

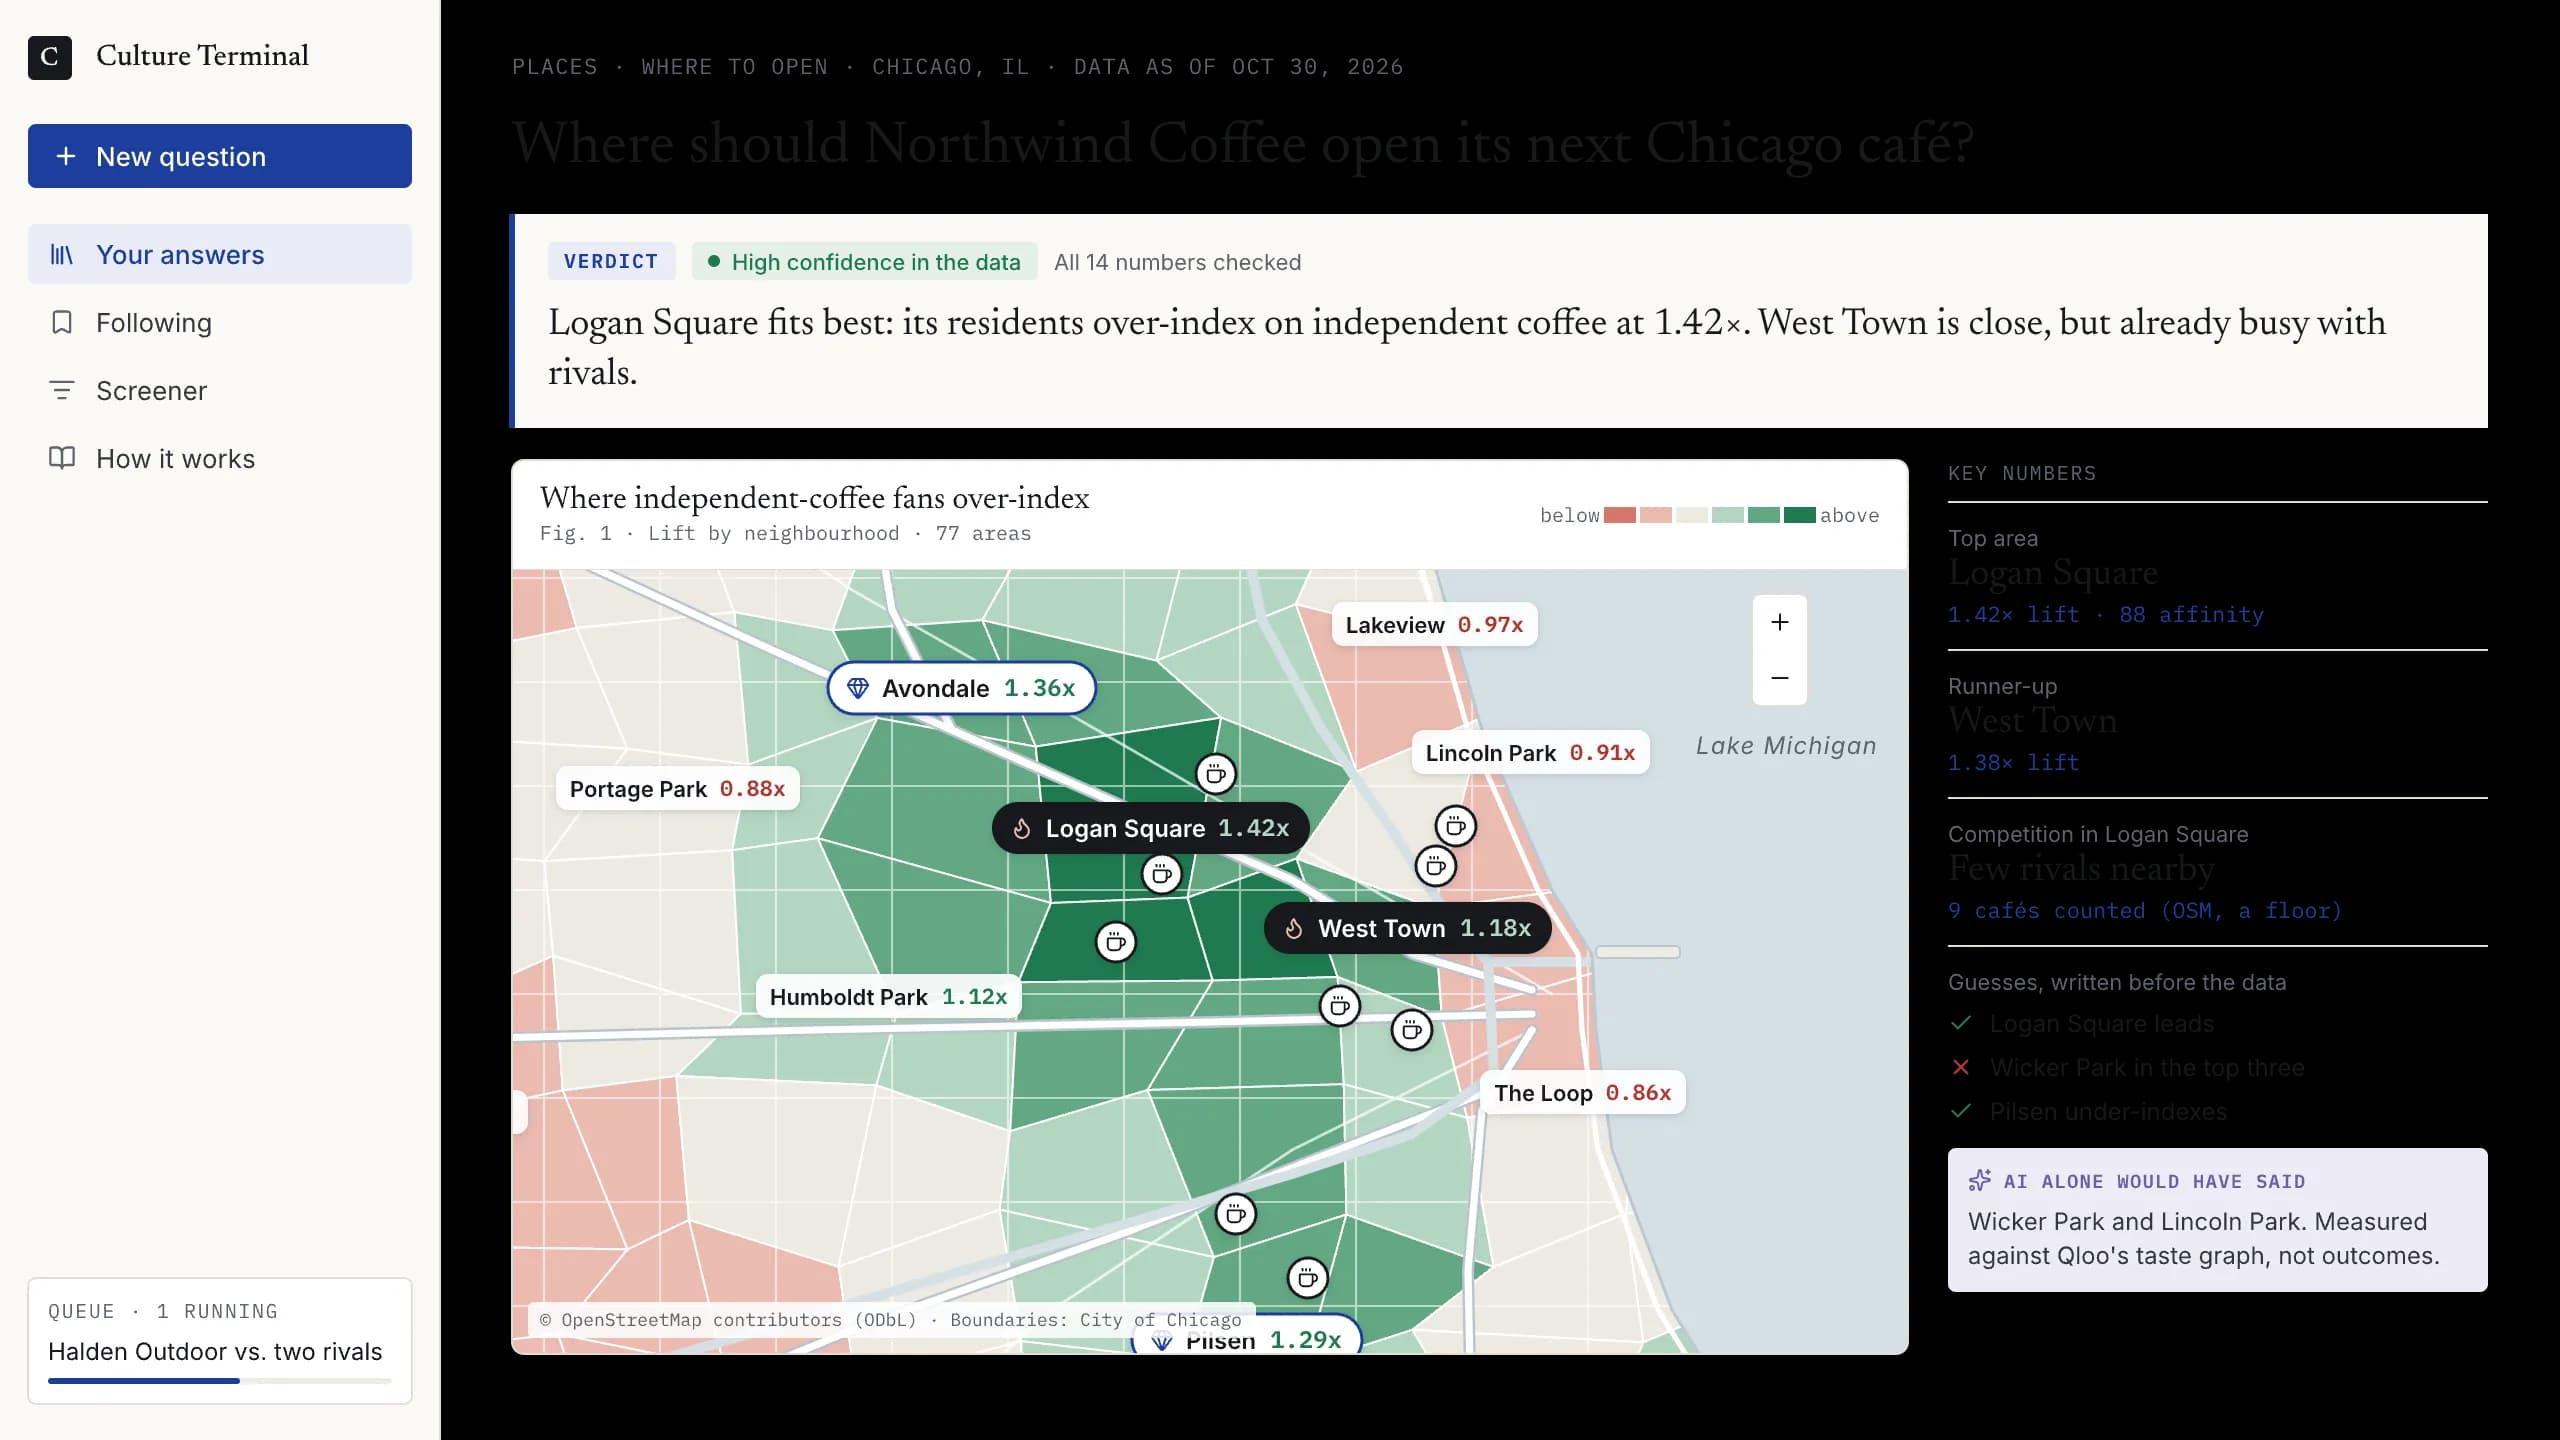
Ask one question in plain English. In about a minute you get a one-page answer with a verdict, maps and charts. Every number is computed in code and traced to the request that produced it.

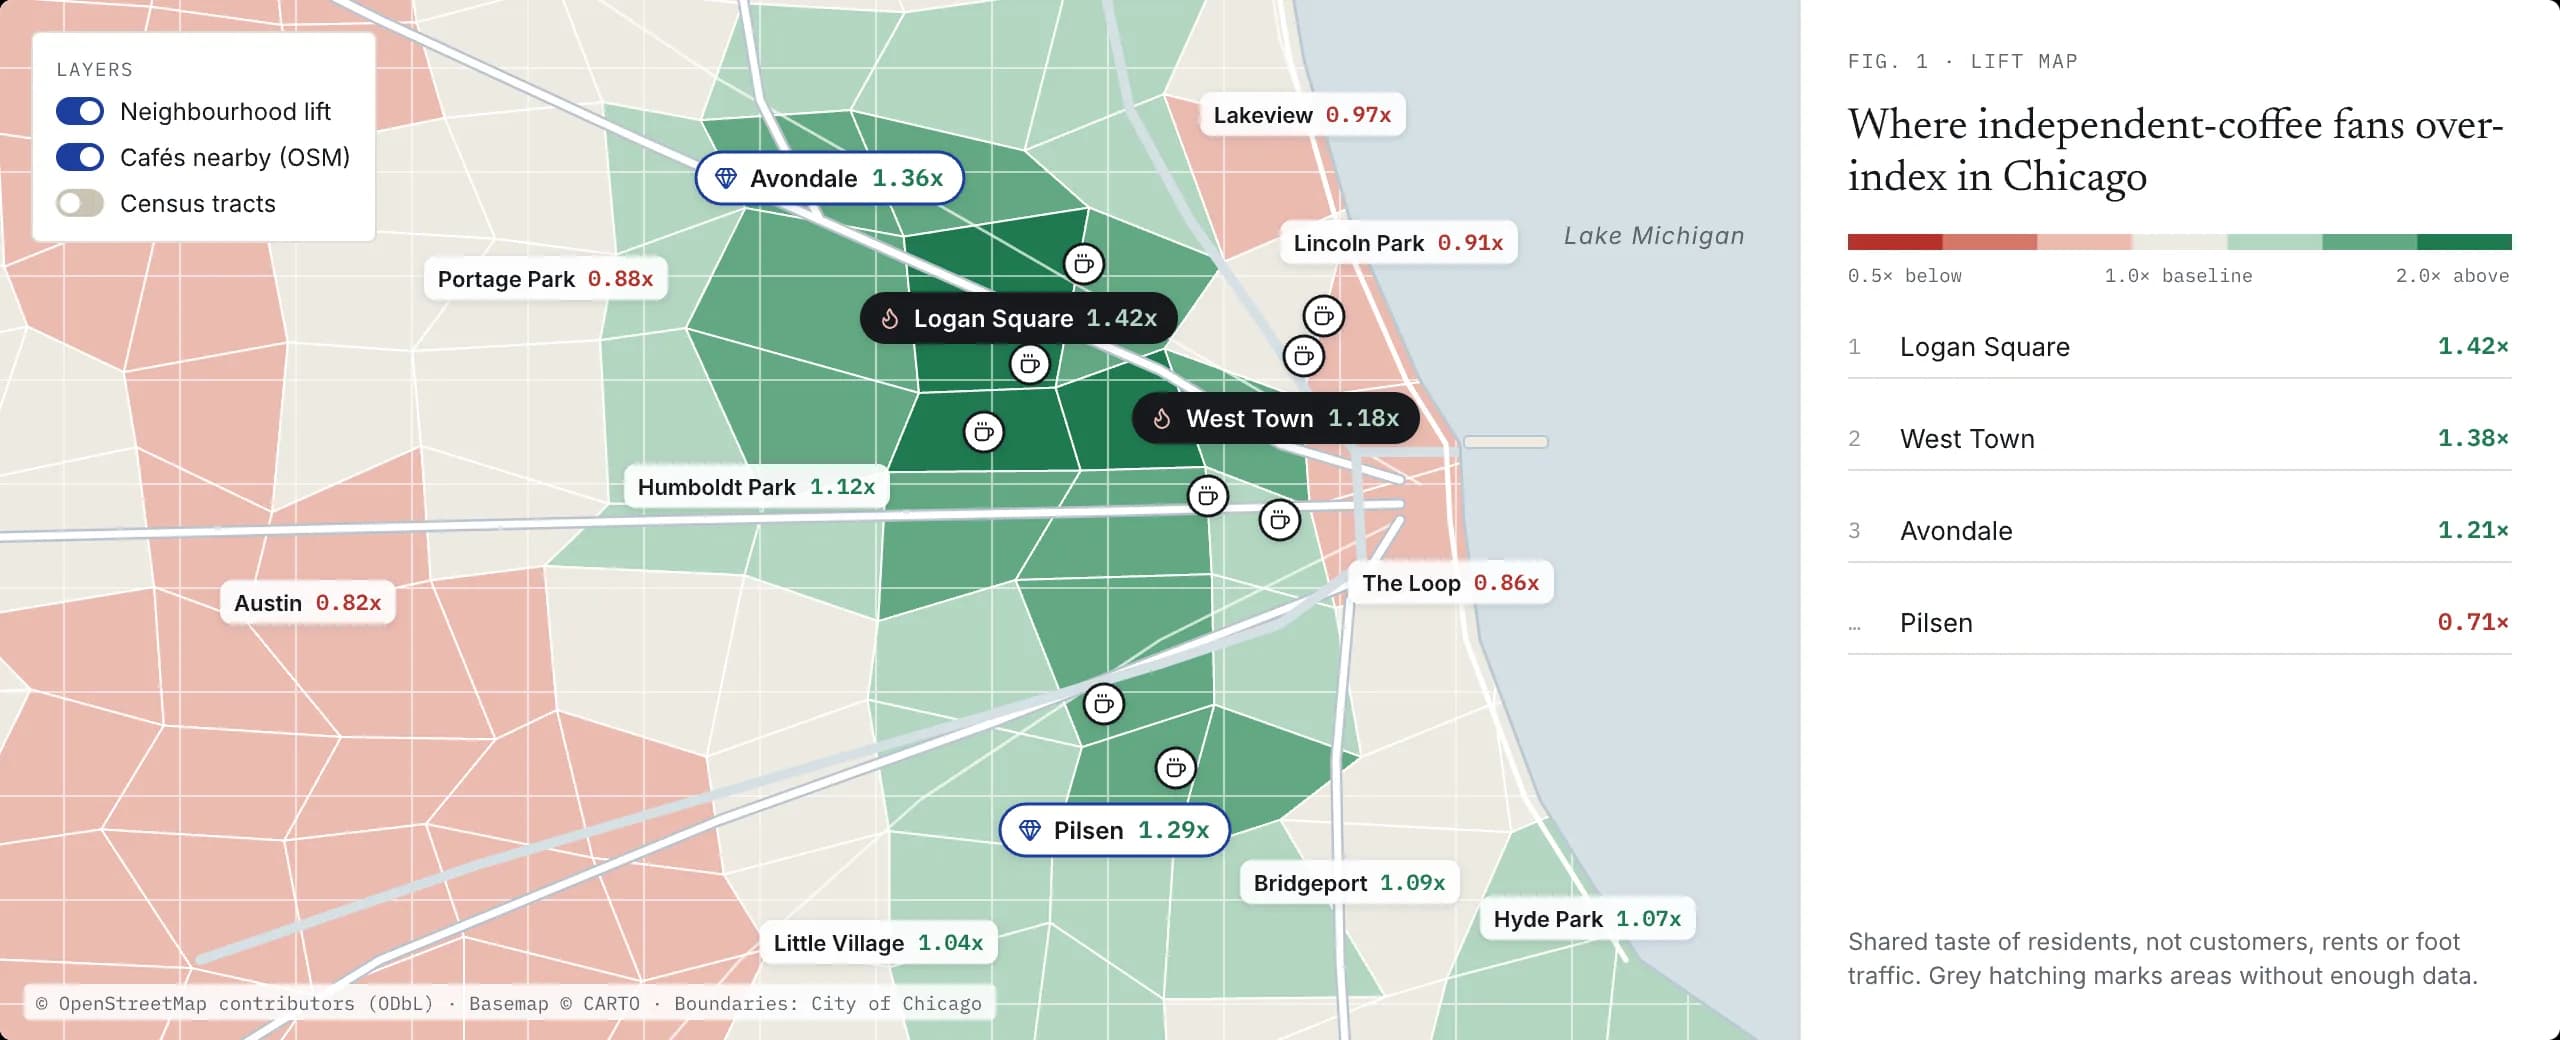
An answer page: a verdict with rule-scored confidence, a neighbourhood lift map of Chicago, three key numbers, the guesses written before the data, and what AI alone would have said.
Illustration. The brand and figures are invented.

What every answer is built from

  • Qloo taste dataGroup-level affinity across brands, places, music, film, TV and podcasts
  • US Census ACSWho lives in an area: residents, not customers
  • SEC EDGARReported company financials, company-wide
  • OpenStreetMapCounts of nearby places. A floor, never a full list
  • The web, datedPublisher, title and date on every finding. Shown apart, never verified

How it works

One question in. A one-page answer out, with the working shown.

No pickers, no dashboard to configure. Ask the way you would ask a colleague.

  1. 01

    Ask in plain English

    Up to 400 characters, read into one of 13 jobs. Names are matched exactly; if one is ambiguous, you pick.

  2. 02

    Watch it work

    About a minute, step by step: the opening scan, guesses written before any data, follow-ups the data triggers. Stop at any time.

  3. 03

    Get the answer, with proof

    A verdict, rule-scored confidence, key numbers, maps and charts. Every number opens to the request behind it.

Four desks · thirteen jobs

Built for the teams who put money behind a guess about taste.

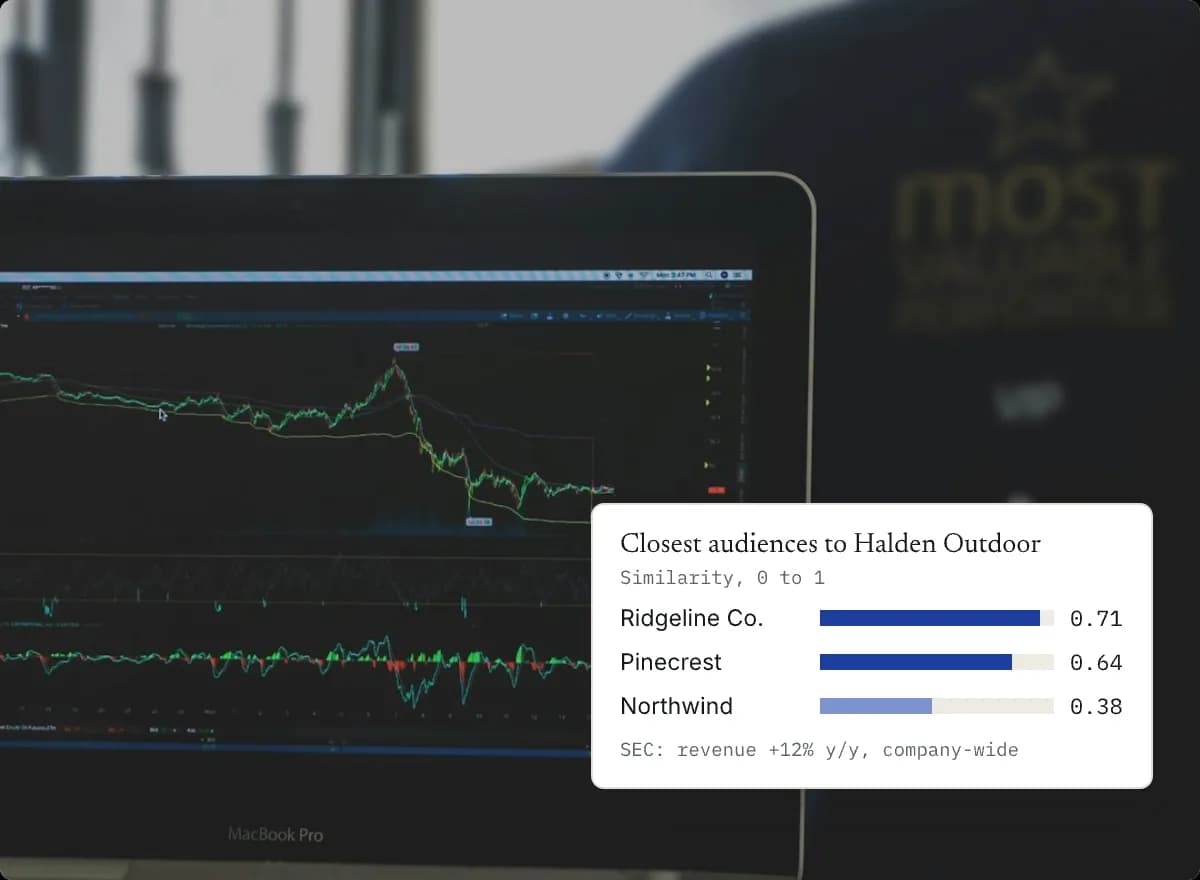
Outdoor gear on a shelf, with a chart of the closest audiences to an invented outdoor brand.

01 · Brands & investing

For investors and brand strategy

See which brands really share an audience, how two brands split cities and age groups, and whether a new product idea has a home. Reported SEC figures sit beside the taste data, company-wide.

  • Real competitorsHLTH
  • Compare two brandsVS
  • Test a new productLNCH

Not financial advice. No buy, sell or price calls.
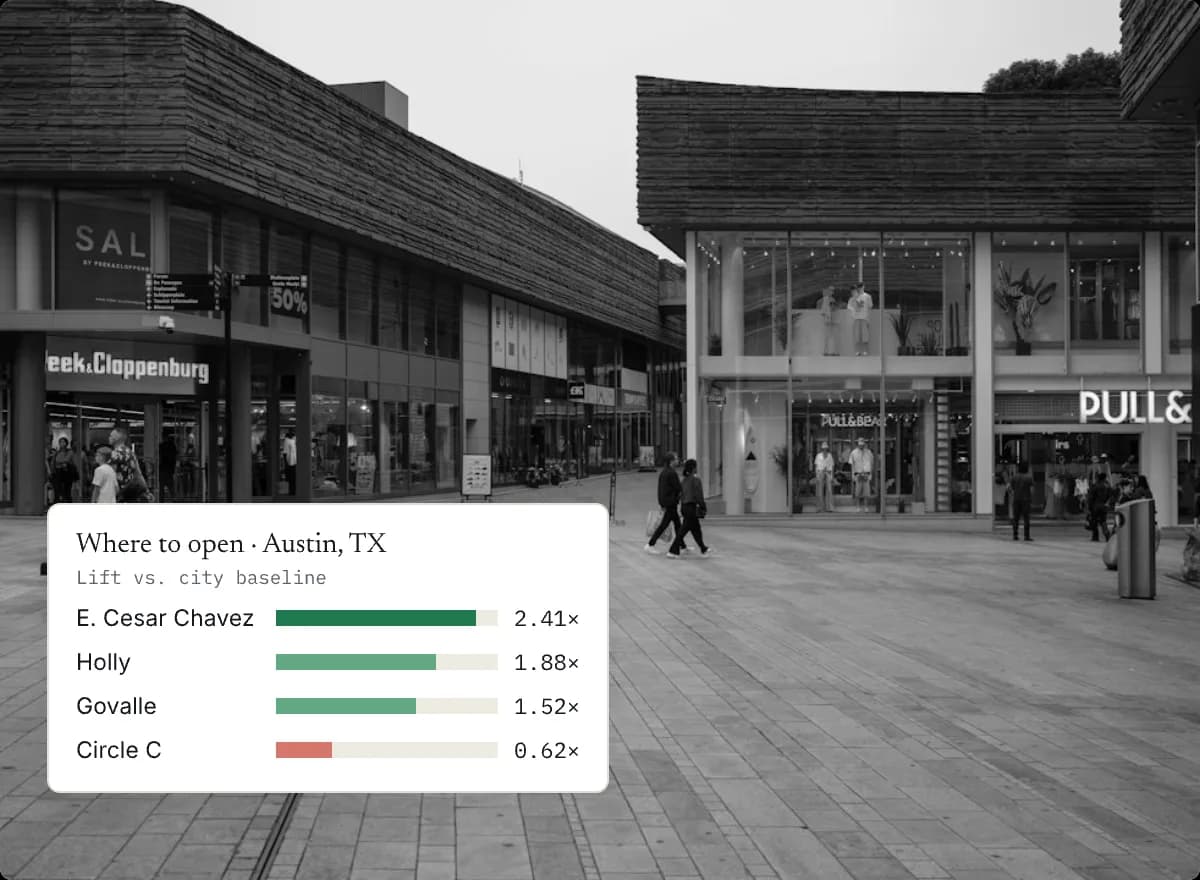
A city street with shopfronts, with a chart of neighbourhood lift against the city baseline.

02 · Places

For location and real-estate strategy

Find the neighbourhood whose residents' taste fits your concept, the best tenant for a corner, an area's closest twin, or what sets two to four cities apart. Census and OpenStreetMap counts add who lives there and who is already open.

  • Where to openSITE
  • Best tenant for a spaceTEN
  • Read a neighbourhoodDNA
  • Find an area's twinTWIN
  • Compare citiesCITY

Shared taste, not foot traffic, rents or sales.

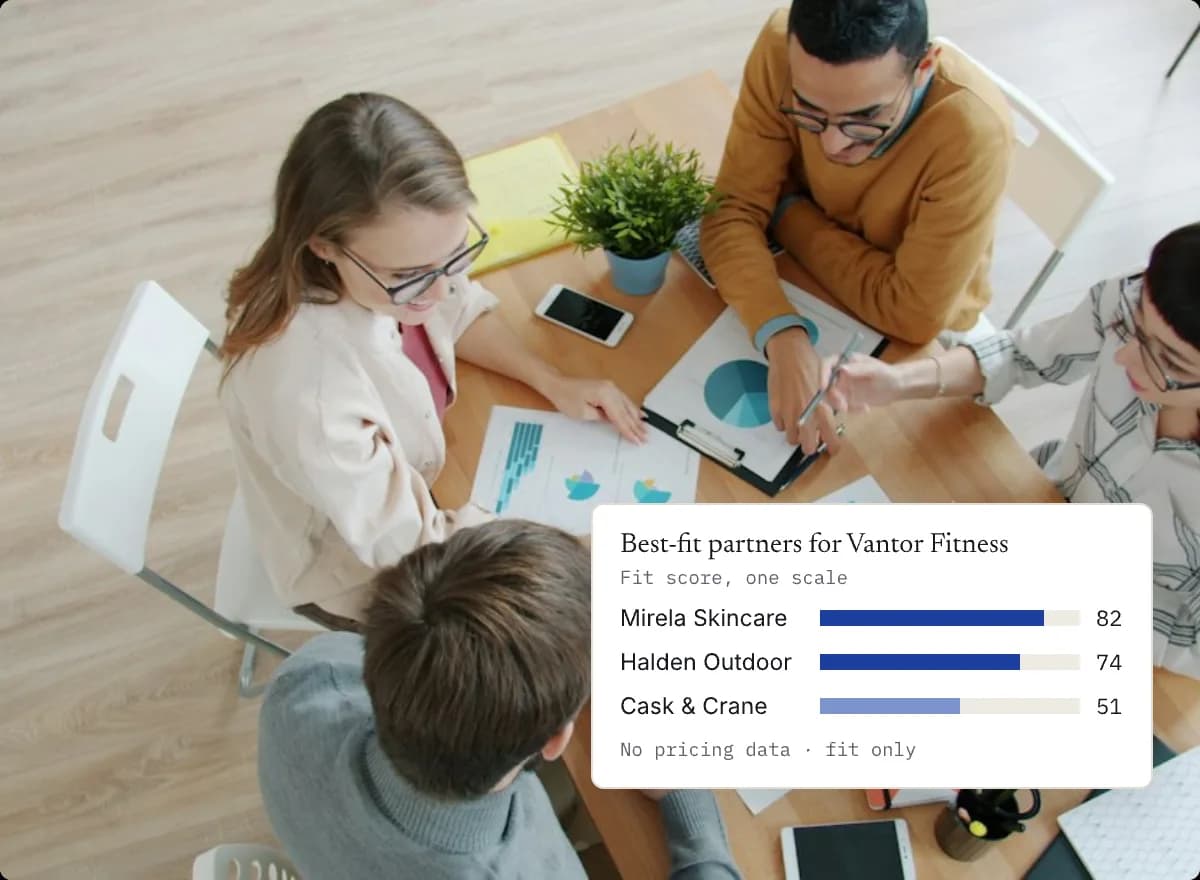
A live event crowd, with a chart of best-fit partners for an invented fitness brand.

03 · Sponsors & tours

For marketing, sponsorship and touring

Score sponsors and partners on audience fit, pick launch and tour cities, and find artists and podcasts whose fans look like yours.

  • Sponsor fitSPON
  • Launch & tour citiesMKTS
  • Brand collaborationsCOLLAB
  • Artists & podcasts who fitCRTR

Fit only. No fees, pricing or ROI.

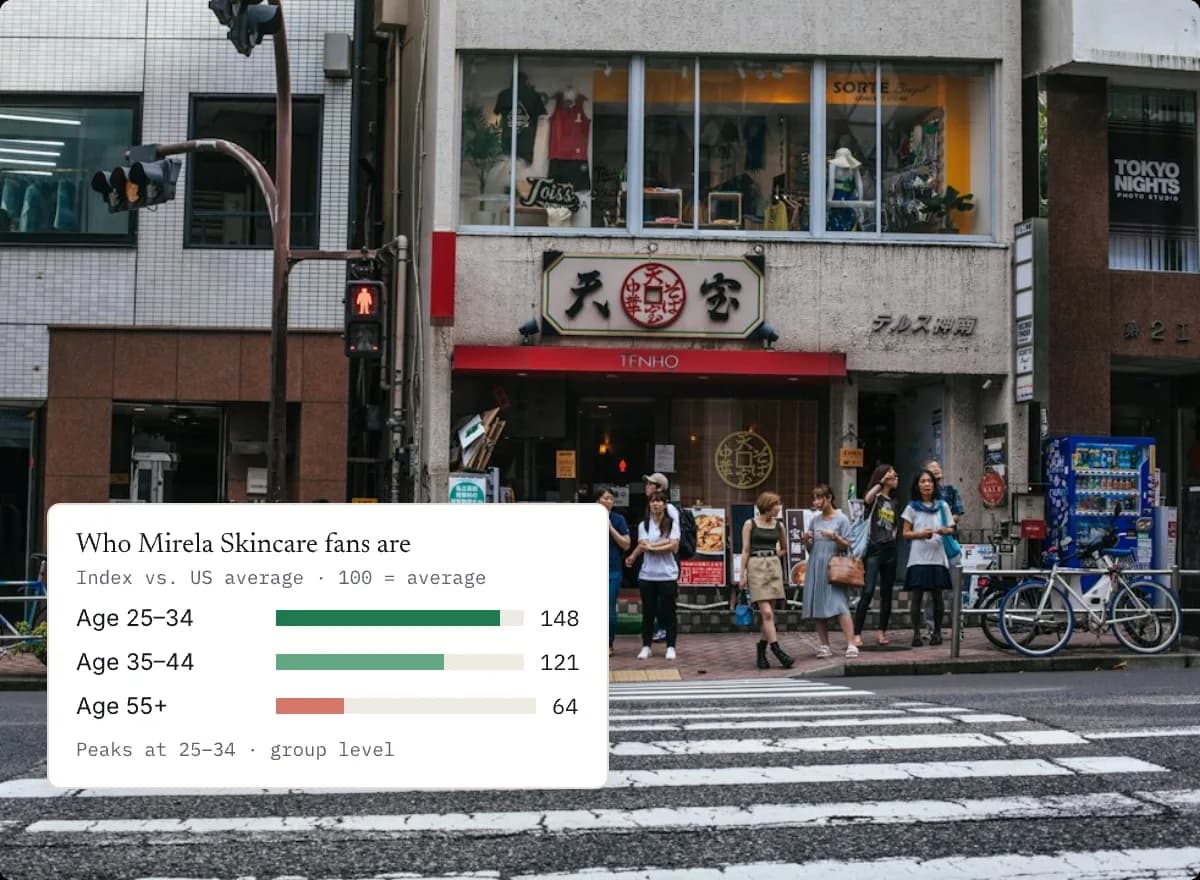
People in conversation, with a chart of an invented brand's fans by age against the US average.

04 · Audiences

For audience research

Who the fans are, how they lean by age and gender, and what else they love, from brands to films to podcasts. Group-level only, never individuals.

  • Who they areAUD

No individuals and no sensitive traits.

The figures

Maps, tables and grids you can put in front of a board.

Each chart states its limit. Each value opens to its request. Missing data is named, never drawn as zero.

A neighbourhood lift map of Chicago with a layer switcher, a colour legend from below to above the city baseline, and a ranked list of areas.
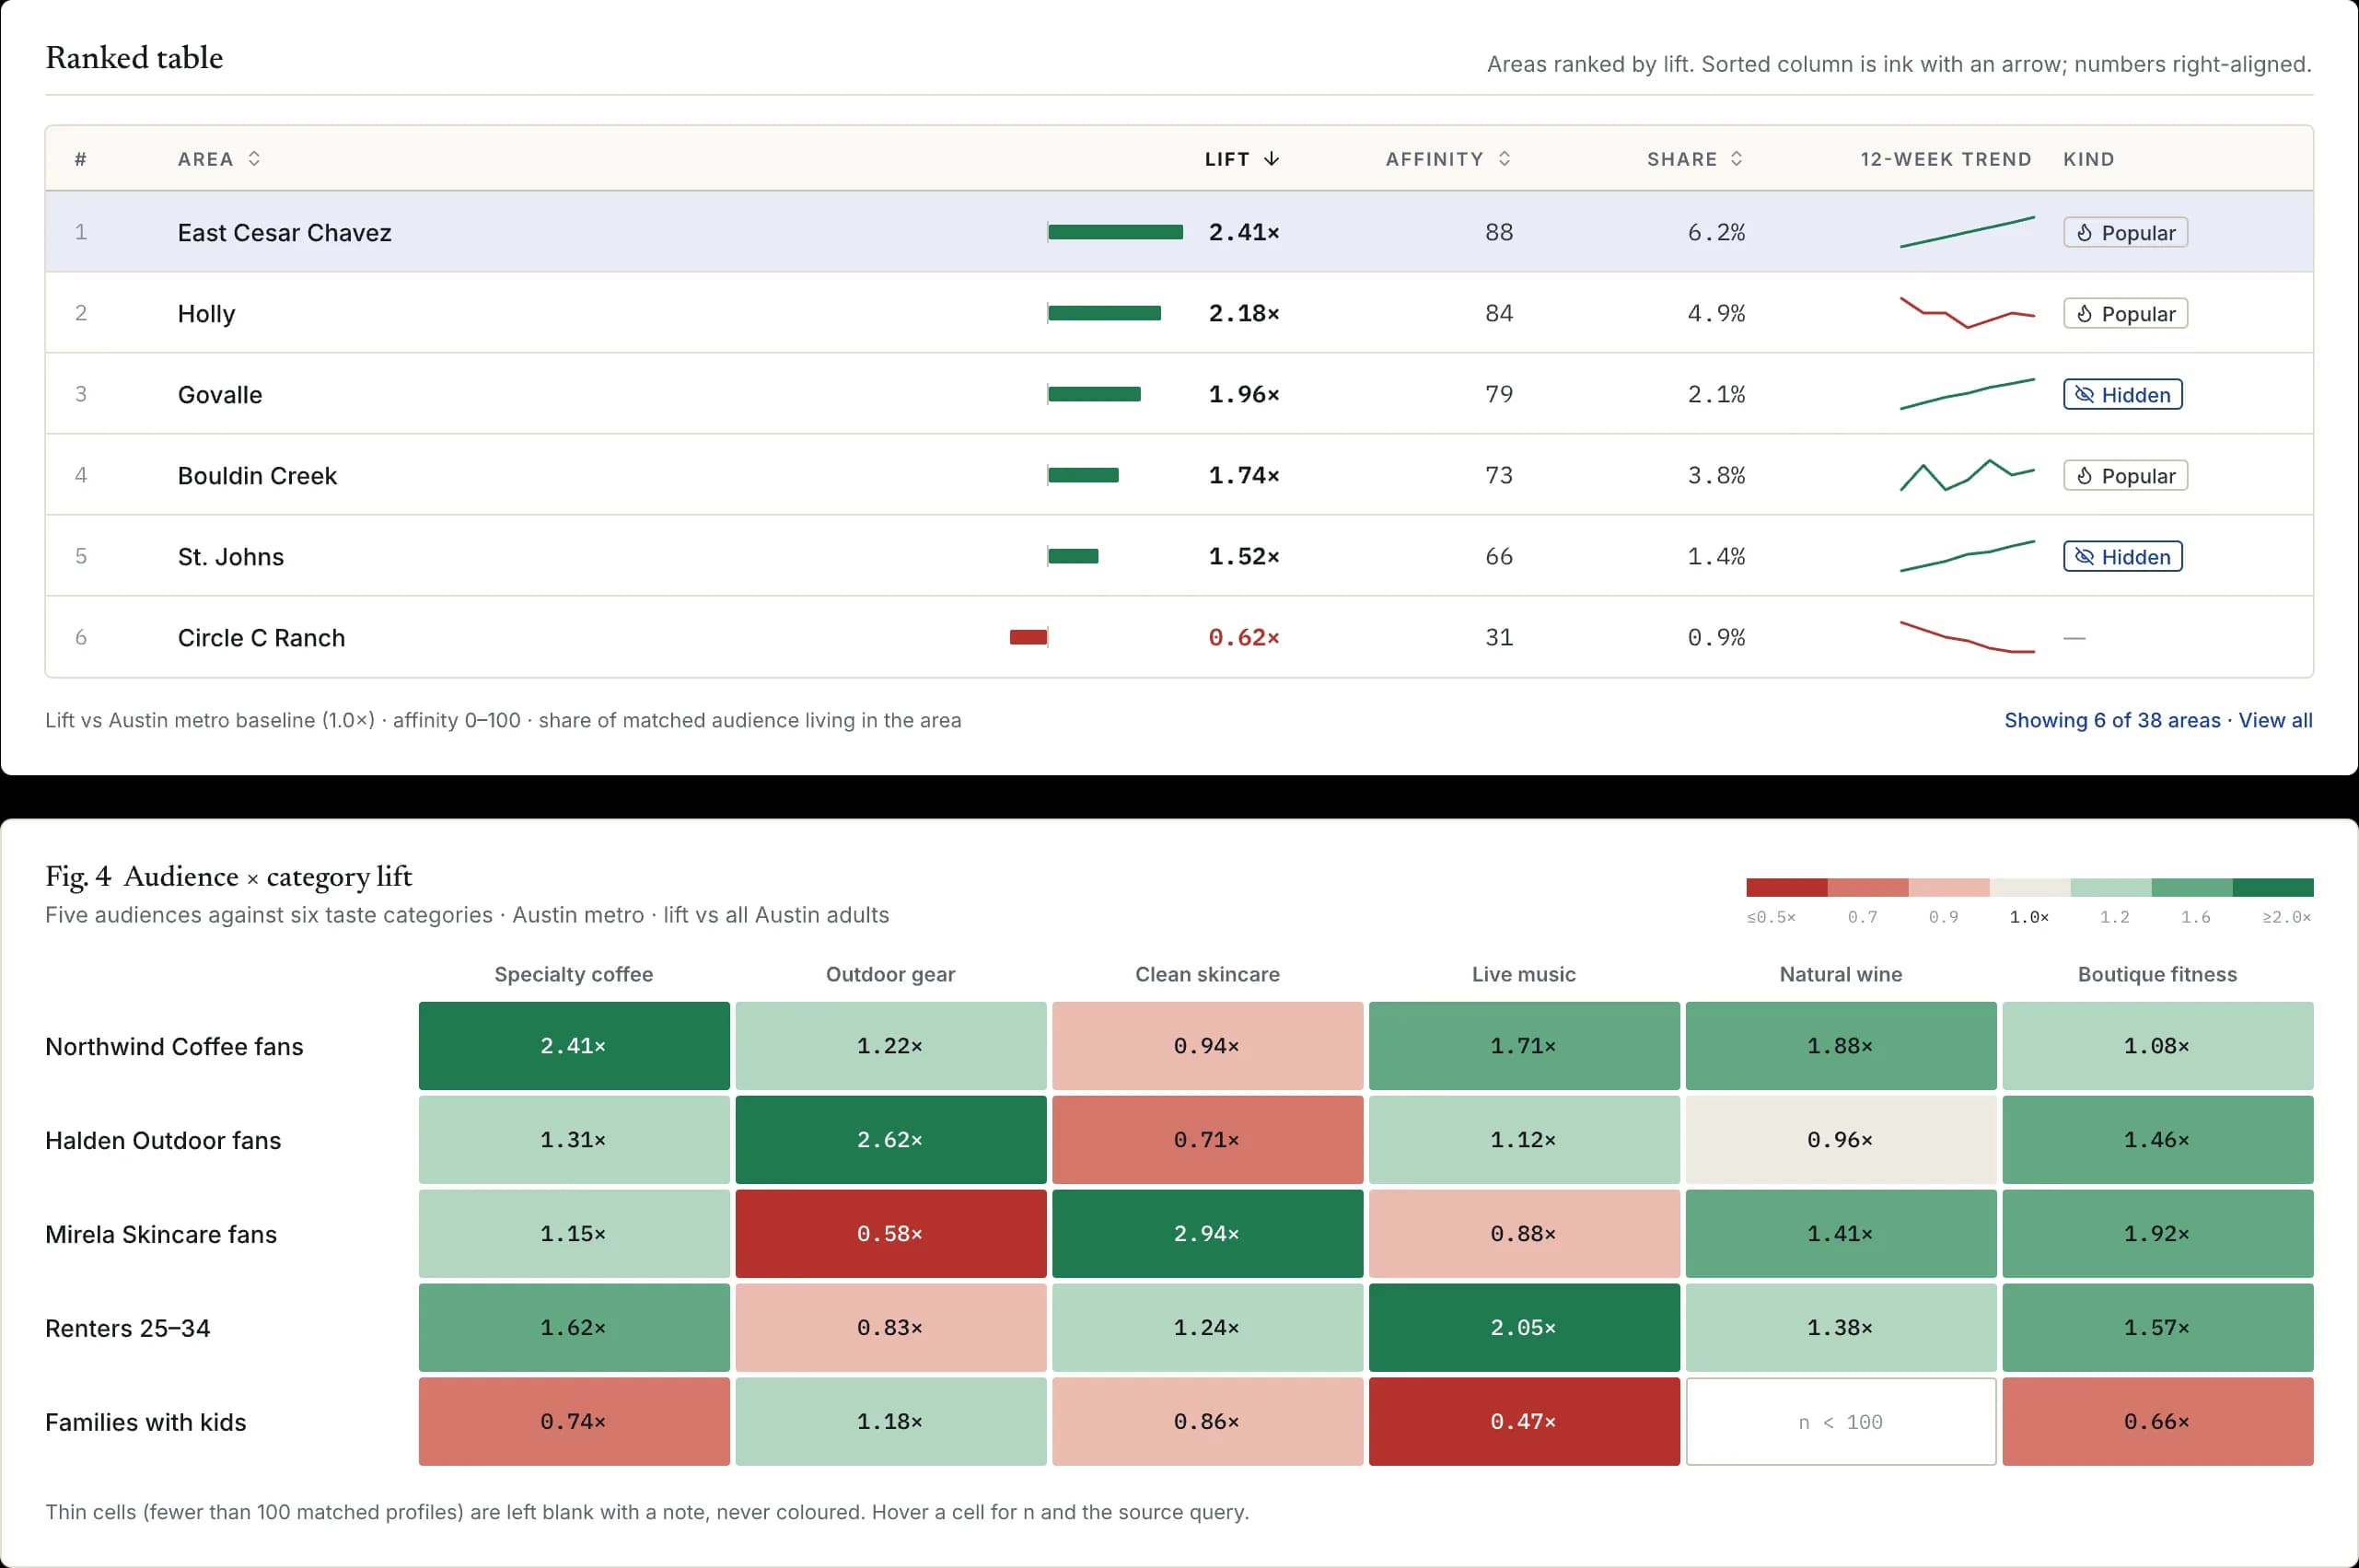
A ranked table of Austin areas by lift, affinity and share, and a heatmap of five audiences against six taste categories with thin cells left blank.
Illustration. The brand and figures are invented.

Honest by construction

We say what we do not know.

An answer is only worth acting on if you can see where it is thin.

  • The AI never types a number

    Every figure is computed in code and traced to a logged request. A checker reads the page and states that every number was checked, or says which were not.

  • Confidence rates the data

    It is scored by fixed rules, not by how sure the model sounds. You see what lowered it and the caps it hit. It is not the chance of being right.

  • Missing data stays missing

    No zeros, no flat lines, no guesses filled in. A gap is named in words with the reason.

  • AI alone, shown beside the data

    Each answer shows what a model alone would have said, and the analyst's guesses written before the data, scored after.

Shown apart from the measured answer

What AI knows (not verified)

Model knowledge · no figures

Background the model already knows about the brand or place, written in words and kept out of the numbers.

From the web

Dated findings

Each finding names its publisher, title and date. It never changes the measured answer.

Confidence: rule-scored

Rates the data behind this answer, not the chance it is right. The page lists what lowered it.

What we don't do

  • No individuals, only groups
  • No politics, religion, health, ethnicity or other sensitive traits
  • No housing, credit, job or insurance decisions
  • No buy, sell or price advice

What the data cannot tell you

  • Affinity is shared taste, not sales
  • No sales, prices, rents or foot traffic
  • Census describes residents; SEC is company-wide
  • OpenStreetMap counts are a floor, not a full list

Limits and access

Plain limits, written down before you hit them.

Early access

Every desk, every figure, every source.

Open now
New answers
A daily and an hourly allowance, plus a cap on runs at once
Answers you already have
Reopen any time, no limit
Following, screener and profiles
Each has its own allowance, stated where you use it
Each answer
About a minute. If a run stops early, the page says what is missing

Paid plans with higher limits are not open yet. When they are, this page will say so first.

Coverage

cities with neighbourhood maps
13
US cities at market level
51

Atlanta, Austin, Boston, Chicago, Dallas, Denver, Houston, Los Angeles, Miami, Nashville, New York City, San Francisco, Seattle

  • Trends over time for brands and TV only
  • Profiles for brands, artists, public figures, podcasts, TV shows and films
  • Other places are named as not covered, never swapped for a nearby one

Questions

What buyers ask before they start.

For analysts: every formula and rule is published.

Read the method

Group-level taste data from Qloo, US Census ACS, SEC EDGAR filings and OpenStreetMap place counts. Web findings, when shown, carry their publisher and dates and sit apart from the measured answer.

Ask the question you would otherwise guess at.

One plain-English question. A one-page answer in about a minute, with every number traced.